

EOF-EEMD
EOF-EEMD Statistical Analysis and Visualization Package
Data Status:
Published
Publication State:
7 September 2018
Brief Introduction
Many variables of interest, such as air pollutants and meteorological parameters, often exhibit complex spatial and temporal variabilities. In particular, these variables contain many temporal scales that are non-periodic and non-stationary, challenging proper quantitative characterization and visualization.
The EOF-EEMD analysis-visualization package we complied aims to evaluate the spatiotemporal variability across scales, which can be periodic/stationary or not. As shown in the figure below, the package consists, in order, of an EOF analysis (Lorenz, 1956), an EEMD analysis (Wu et al., 2009), a Hilbert-Huang Transform (HT) with Marginal Spectrum Analysis (MSA), and a visualization step to quantitatively depict the spatial-temporal scales of measurement or model data.
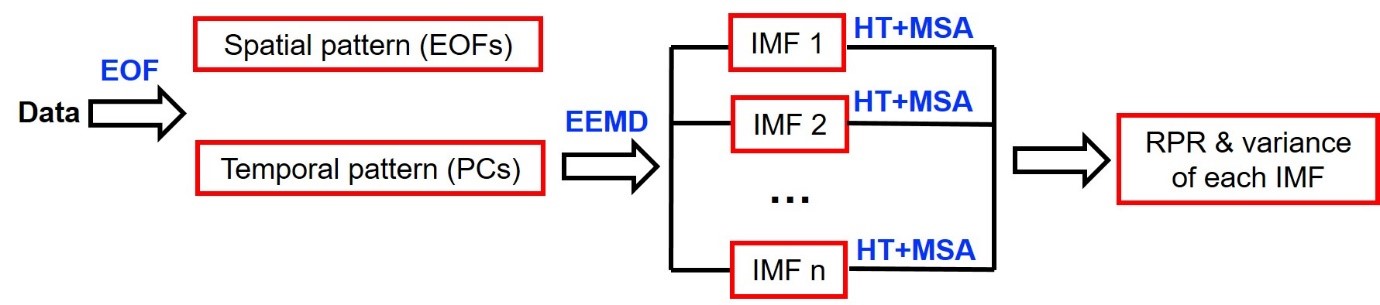
Figure. The flow chart of EOF-EEMD analysis-visualization package. The red boxes represent quantities visualized. Source: Liu et al. (2018).
Download EOF-EEMD
See here (including user guide, a full IDL version, and a partial MATLAB version)
Note that parts of the codes are adopted from Zhaohua Wu in MATLAB, and parts are modified from Jinxuan Chen and May Fu's codes. See user guide for detailed credit descriptions.
References
Liu, M.-Y., Lin, J.-T. *, Wang, Y.-C., Sun, Y., Zheng, B., Shao, J., Chen, L.-L., Zheng, Y., Chen, J., Fu, M., Yan, Y.-Y., Zhang, Q., and Wu, Z.: Spatiotemporal variability of NO2 and PM2.5 over Eastern China: observational and model analyses with a novel statistical method, Atmospheric Chemistry and Physics, 18, 1–20, doi:10.5194/acp-18-1-2018, 2018 (PDF) (Supplement)
Wu, Z., Huang, N. E., and Chen, X.: The Multi-Dimensional Ensemble Empirical Mode Decomposition Method, Adv. Adapt. Data Anal., 1, 339–372, https://doi.org/10.1142/S1793536909000187, 2009
Lorenz, E. N.: Empirical Orthogonal Functions and Statistical Weather Prediction, Dep. Meteorol. MIT, 1(Statistical Forecasting Project;Scientific Report No. 1), 49, 1956
